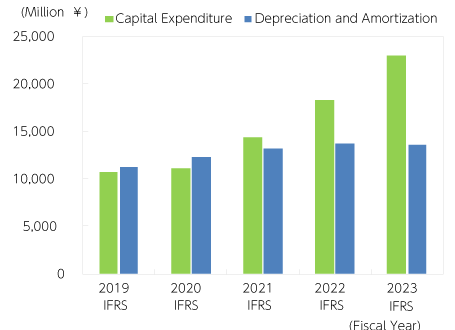
Capital Expenditure, Depreciation and Amortization

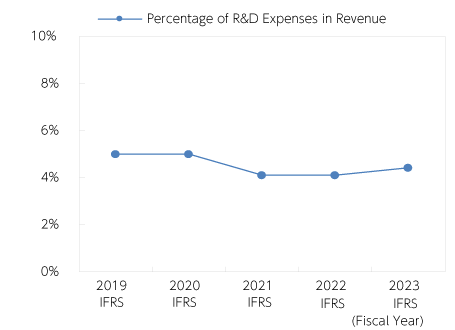
Percentage of R&D Expenses in Revenue

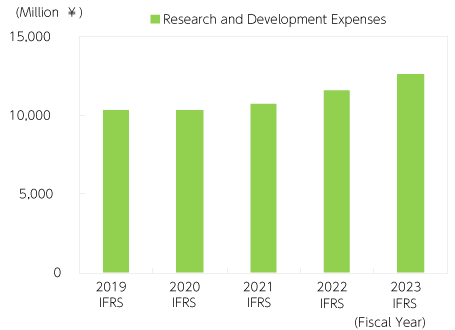
Research and Development Expenses

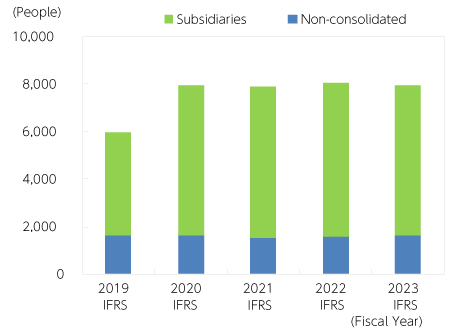
Number of Employees

(Million ¥)
| FY2019 | FY2020 | FY2021 | FY2022 | FY2023 | ||
|---|---|---|---|---|---|---|
| Capital Expenditure | 10,773 | 11,138 | 14,408 | 18,313 | 22,980 | |
| Depreciation and Amortization | 11,278 | 12,259 | 13,221 | 13,774 | 13,640 | |
| Research and Development Expenses | 10,338 | 10,363 | 10,731 | 11,582 | 12,641 | |
| Percentage of R&D Expenses in Revenue | 5.0% | 5.0% | 4.1% | 4.1% | 4.4% | |
| Number of Employees at End Period | 5,969 | 7,937 | 7,916 | 8,044 | 7,953 | |
| Non-consolidated | 1,624 | 1,612 | 1,538 | 1,594 | 1,633 | |
| Subsidiaries and Affiliates | 4,345 | 6,325 | 6,378 | 6,450 | 6,320 | |
Remark
| (i) | Calculation method of financial indexes
|
|---|
Topics More
- 2025/02/04 IR Notice Concerning Result of Repurchase of Own Shares Through Off-Auction Own Share Repurchase Trading System (ToSTNeT-3) and Completion of Acquisition of Own Shares
- 2025/02/03 IR Notice Concerning Acquisition of Own Shares and Repurchase of Own Shares Through Off-Auction Own Share Repurchase Trading System (ToSTNeT-3)
- 2025/02/03 IR Summary of Consolidated Business Results for the Nine Months Ended December 31, 2024
- 2024/11/05 IR Summary of Consolidated Business Results for the Six Months Ended September 30, 2024
- 2024/10/31 IR Notice Concerning Dividends of Surplus (Interim Dividend)


 Inquiry
 FAQ
FAQ