Reducing Energy Use and CO2 Emissions
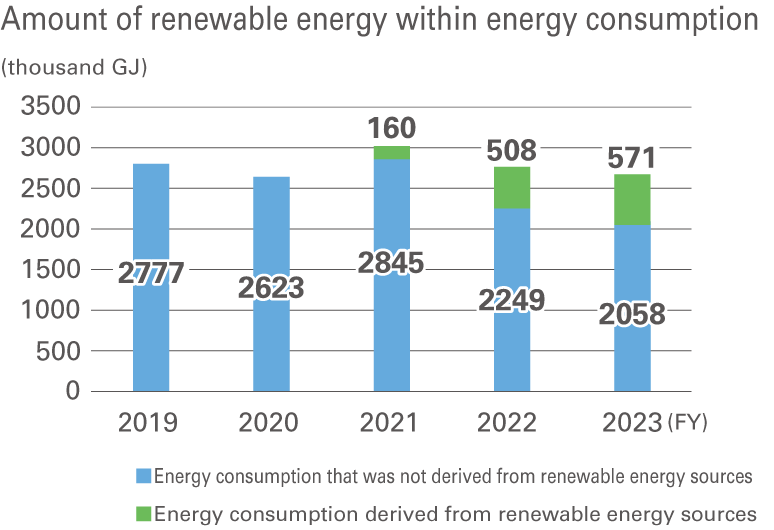
All of our domestic business sites have switched their purchased electricity to electricity derived from renewable energy sources at all manufacturing and research sites, which is significantly reducing CO2 emissions from fiscal 2022 onward.
We are also encouraging our overseas business sites to switch to electricity derived from renewable energy sources, and in fiscal 2023 some sites in parts of the China and Southeast Asia region made the switch.
With efforts to actively install solar power generation also playing a role, both energy usage per production amount value and CO2 emissions per production amount value were on a reduction trend during fiscal 2023.
We will continue with our plans to utilize renewable energy sources during fiscal 2024 and beyond, with the view to further reducing CO2 emissions.
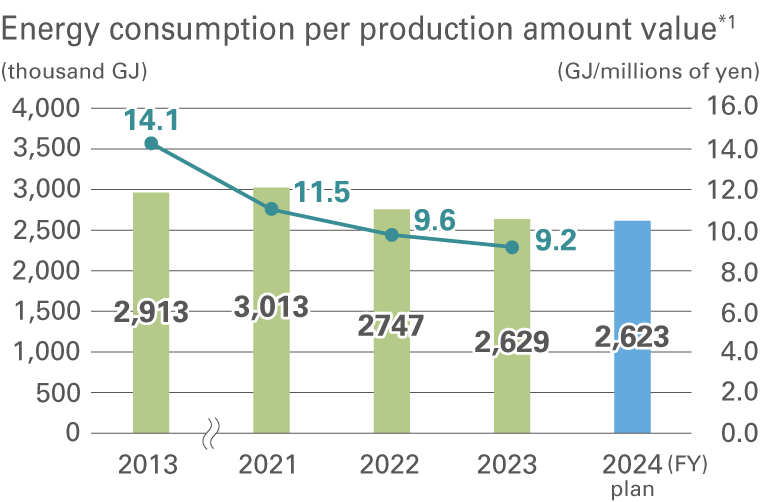
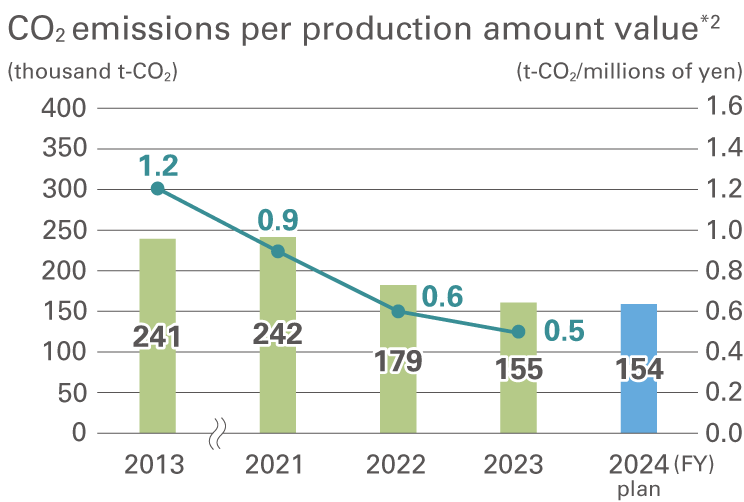
- *1, *2: Energy consumption and CO2 emissions per production amount value are determined using the following equation for sales per production amount value.
- • Energy consumption per production amount value = Energy consumption [thousand GJ] / Net sales [millions of yen]
- • CO2 emissions per production amount value = CO2 emissions (Scope1+Scope2) / Net sales [millions of yen]
- *1: From disclosure for the current period, the unit for energy consumption has been changed from crude oil equivalent (kL) to calorific value (GJ), including past fiscal years. The heat conversion coefficient for electricity consumption, including that in the past, has been changed to 3.6 GJ/thousand kWh.
Initiatives for Reducing Emissions During the Production and Sales Stages (use of Renewable Energy)
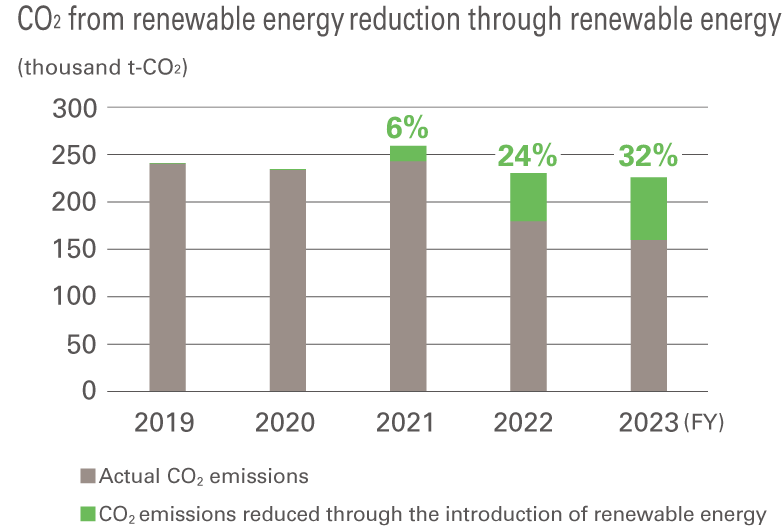
At our domestic business sites, we have switched from purchased electricity to electricity derived from renewable energy sources at all major business sites. We are also encouraging our overseas business sites to make the switch, and are actively installing solar power generation. As a result, our global CO2 emissions reduced by the use of renewable energy sources came to 32% of the total in fiscal 2023.
Initiatives for Reducing Emissions During the Production and Sales Stages (Excluding Use of Renewable Energy)
We have focused on fuel conversion from petroleum-based fuels to natural gas from an early stage.
Natural gas reduces SOx and NOx emissions as well as CO2 emissions by about 30%, compared to petroleum-based fuels.
In domestic business sites, we began switching over from around 2005. And in 2009, most of our plants directly operating under Sumitomo Bakelite’s management had been converted to natural gas (city gas). Even subsidiaries that were slow converting due to certain infrastructure issues are now moving ahead with initiatives for gas conversion.
Overseas, business sites in North America and Europe were early in converting to natural gas, but sites in China and other Asian regions have also been gradually converting to natural gas, and by 2023, most business sites had completed the fuel conversion.
Currently, natural gas and other energy sources account for around 87% of the fuel used by the entire Sumitomo Bakelite Group, but we are aiming to achieve 90% or more by 2027 by moving ahead with conversion at our domestic subsidiaries.
Scope 3 Data Disclosure
In 2015, our Group began calculating and disclosing Scope 3 emissions in the supply chain of business sites belonging to Group companies in Japan because of the growing importance of understanding and reducing CO2 emissions covering the entire supply chain. In fiscal 2018, we enlarged the scope to cover overseas business sites.
Both in Japan and overseas, Category 1 “Purchased goods and services” accounted for a large portion of CO2 emissions, and reducing these remains a challenge going forward.
In fiscal 2024, we set a new Scope 3 reduction target and have been accelerating our efforts to acquire SBTi certification.
Scope3 CO2 Emissions and Emissions in Each Category
(At Sites in Japan and Overseas)
| No. | Category | Emissions (thousand t-CO2/year) |
|---|---|---|
| 1 | Purchased goods and services | 718 |
| 2 | Capital goods | 65 |
| 3 | Fuel- and energy-related activities not included in Scope 1 & 2 | 39 |
| 4 | Upstream transportation and distribution | 61 |
| 5 | Waste generated in operations | 6 |
| 6 | Business travel | 2 |
| 7 | Employee commuting | 5 |
| 8 | Upstream leased assets*1 | - |
| 9 | Downstream transportation and distribution*2 | - |
| 10 | Processing of sold products*2 | - |
| 11 | Use of sold products*2 | - |
| 12 | Disposal of sold products*2 | 40 |
| 13 | Downstream leased assets*1 | - |
| 14 | Franchises*1 | - |
| 15 | Investments | 11 |
| Scope 3 Total | 947 | |
| Scope 1 (All direct emissions) | 80 | |
| Scope 2 (Indirect emissions associated with purchased power and steam) | 75 |
- Calculation method: We calculated the amount of emissions based on the Emissions Intensity Database for Calculating Greenhouse Gas Emissions of Organizations through the Supply Chain Ver. 3.4 issued by the Ministry of the Environment and the Ministry of Economy, Trade and Industry of Japan, using the emission coefficients stated in this database, and in the IDEA Ver. 3.3 Carbon Footprint Communication Program Basic Database developed jointly by the National Institute of Advanced Industrial Science and Technology and the Japan Environmental Management Association for Industry.
- *1: Not applicable due to business characteristics
- *2: Not calculated
- * See the organizations listed in Editorial Policy regarding those included in the data.
Management of Chemical Substances Throughout Product Life Cycles
The targets for 2020 agreed on at the WSSD call for the worldwide and comprehensive management of chemical substances throughout the product life cycle, from development to manufacturing, use, and disposal in order to minimize the significant adverse effects on human health and the environment caused by the manufacture and use of chemical substances. Since then, the laws and regulations in each country have become stricter, and our Group is taking action to comply with laws and regulations.
Aiming to achieve the SDGs in 2030, the government of each country is taking action proactively. The Group (each of our plants and research institutes worldwide) is working on the SDGs through the management of chemical substances carried out as part of our Responsible Care activities.
In terms of its management of chemical substances, the Group has a system in place for studying and reviewing chemical substance-related laws and regulations in Japan and throughout the world from the product development phase onward. We manage the chemical substances contained in products in order to comply with the laws of the countries where we operate and to minimize environmental impacts throughout product life cycles.
Chemical Substance Management System
We are focusing on promoting the use of SDSs*1 across the Group not only for disclosing information related to chemical substances under regulatory control in Japan and overseas, but also for disclosing relevant information voluntarily so as to improve the quality of the Group’s information disclosure practices. Particularly for the GHS*2 system, we have introduced ExESS*3 and offer SDS and labels that are compliant with the laws and regulations of 46 countries and territories, including Japan, in the official languages of each country. We are revising our SDSs to comply with the addition of substances subject to the Industrial Safety and Health Act from April 2023.
- *1 SDS: Acronym for Safety Data Sheet. This sheet contains the safety information regarding chemical substances, and is attached to product shipments to other businesses.
- *2 GHS: Acronym for the Globally Harmonized System of Classification and Labelling of Chemicals.
- *3 ExESS: A system for producing and issuing SDS multilingually. Introduced in 2020.
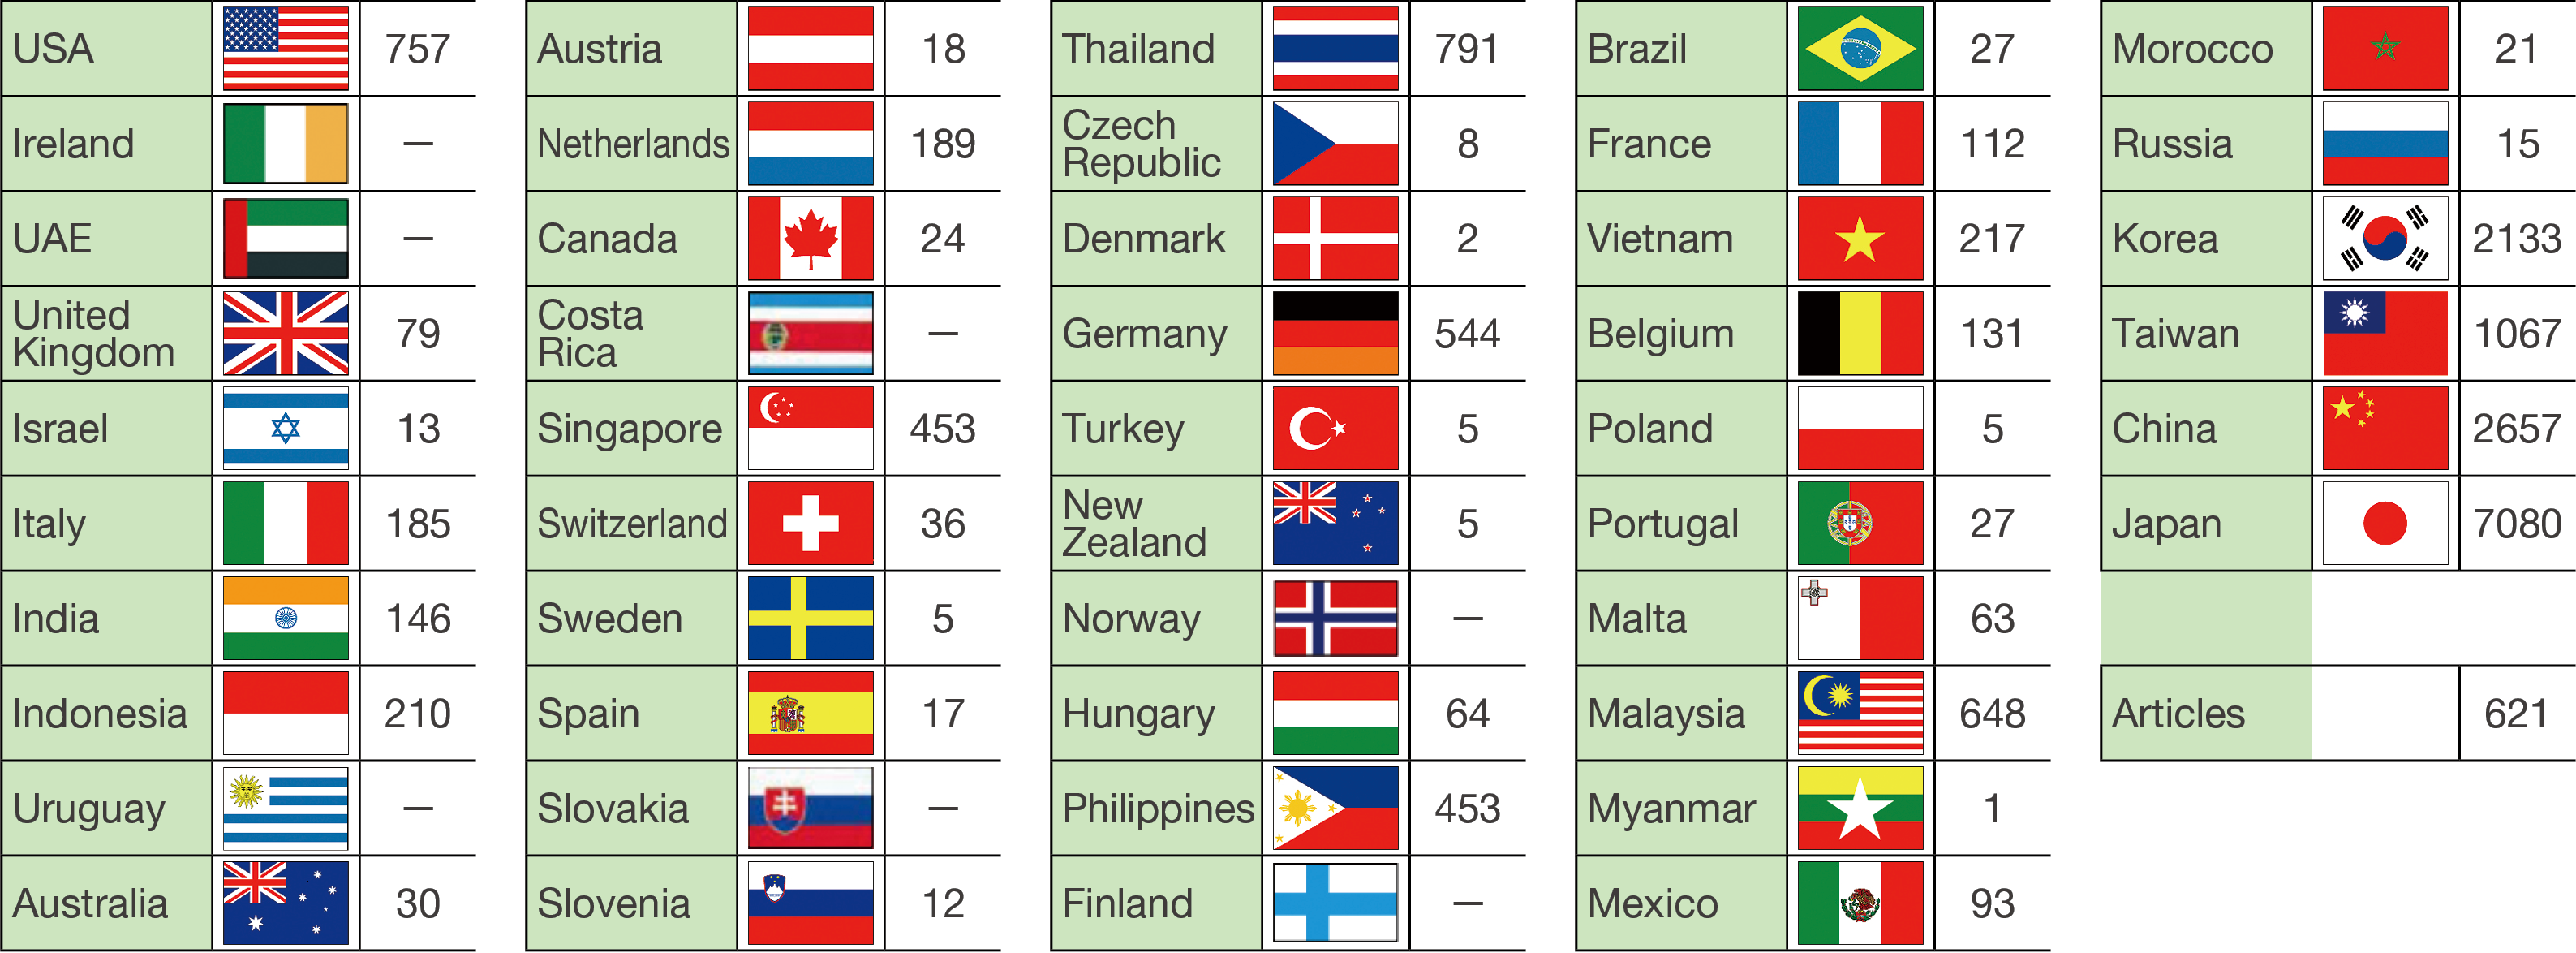
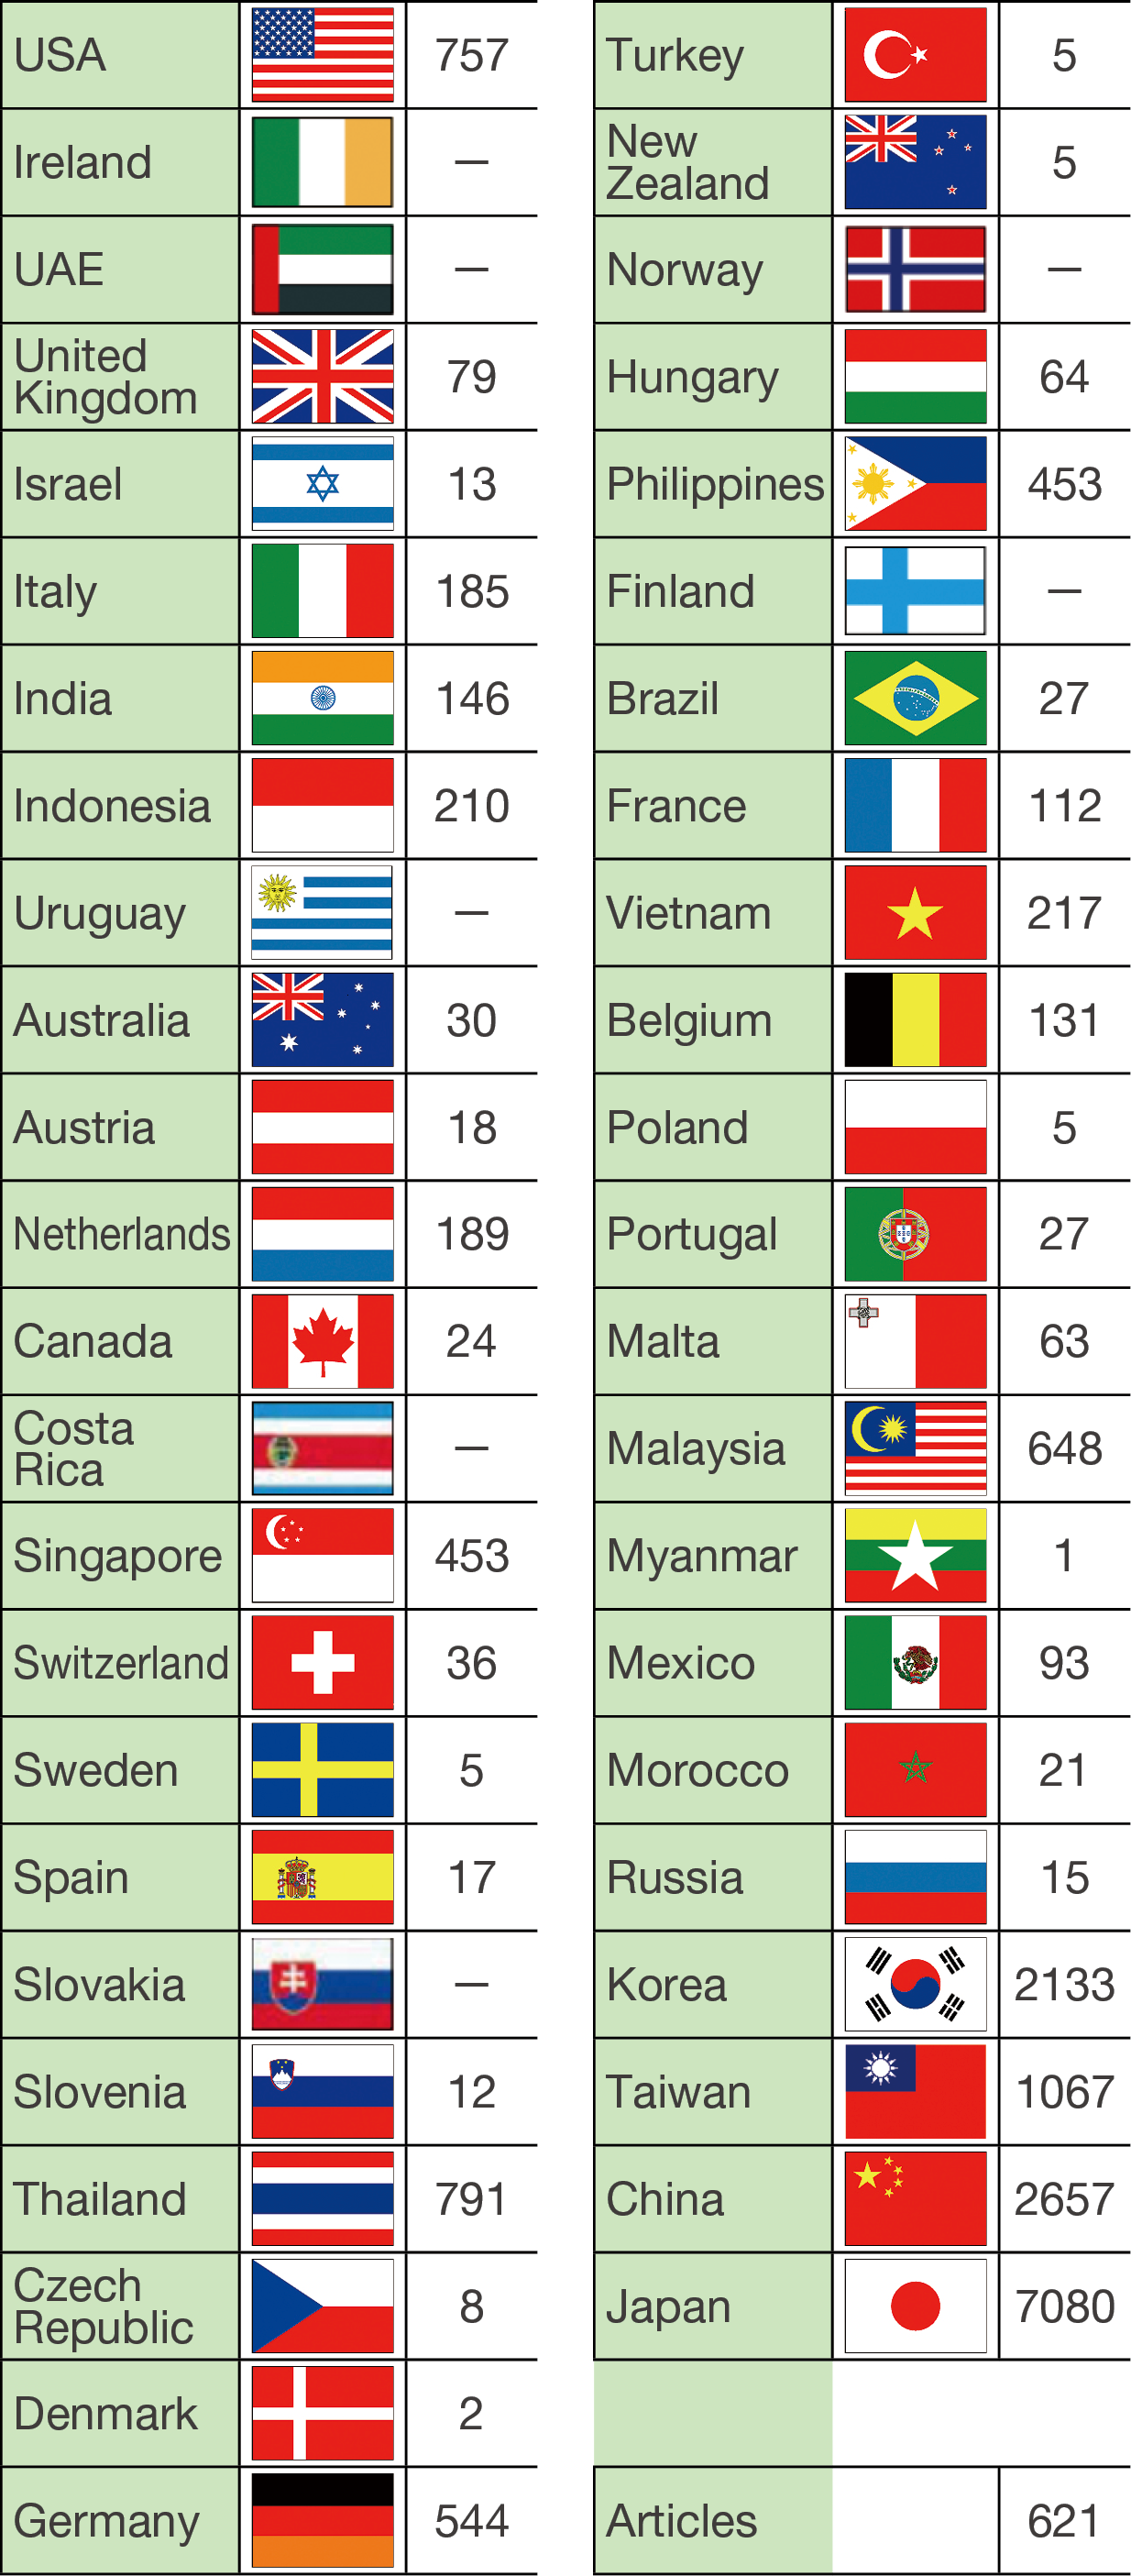
- * Countries and territories for which we provide SDSs: 46 (Asia: 12, Europe: 23, North America: 3, Latin America: 3, Oceania: 2, Middle East: 2, Africa: 1)
- * Items marked with “-” are those for which SDSs were provided in accordance with the local laws and in the local language, but are no longer available due to discontinuation or other reasons.
Waste Management
We believe it is important for our Group to adhere to environmental laws and regulations, and conduct business activities that minimize our environmental impact. For waste, we have established rules for on-site verification of waste disposal contractors in accordance with the Waste Management and Public Cleansing Act, and we continue to manage and quantify the amount of waste generated based on the issuance of manifests. Based on the above, we promote minimization of material loss and effective utilization (reuse/recycling), and promote activities to reduce material loss, including valuable materials.
We also consider it important to work to reduce the environmental impact of society through our products and services as stated in our Environmental Vision for 2050 (Net Zero) “02. Contribute to reducing CO2, including along supply chains”: “Develop products that factor in reducing CO2 throughout their life cycle.” In this context, weight (volume) reduction, longer service life, recycling, and mono-material design are also initiatives by which we reduce waste in the supply chain as well as CO2 emissions.
Meanwhile, we have been systematically disposing of polychlorinated biphenyl (PCB) waste in accordance with the Act on Special Measures concerning Promotion of Proper Treatment of PCB Wastes. Disposal of high-concentration PCBs has been carried out systematically in accordance with the capabilities of the Japan Environmental Safety Corporation (JESCO) in each region, with a view to complete disposal during fiscal 2024. Planned disposal of low-concentration PCBs has also been under way since fiscal 2017, and we are moving forward to complete disposal by the legally mandated deadline.
Reducing Material Loss
Our group is working to increase the efficient use of resources ratio, because it regards the reduction of environmental impacts as an opportunity to improve profitability. The increase in material loss, including both waste and valuable materials, leads to an increase in resource losses and in the loads involved in processing. Through MFCA initiatives, the Group is promoting load reduction through the reduction of material loss and the improvement of effective use of raw materials.
Changes in the type of treatment for waste material at domestic business sites are shown in the graph on the right. The amount of waste treated using a combination of landfills and simple incinerators did drop to 18 t in fiscal 2013 through reduction measures conducted at each site, but subsequent restrictions to exports of waste plastics overseas and the lack of capacity at recyclers in Japan has led to a gradual increase.
We will continue to move forward with loss analysis using MFCA as we aim for still greater reductions.
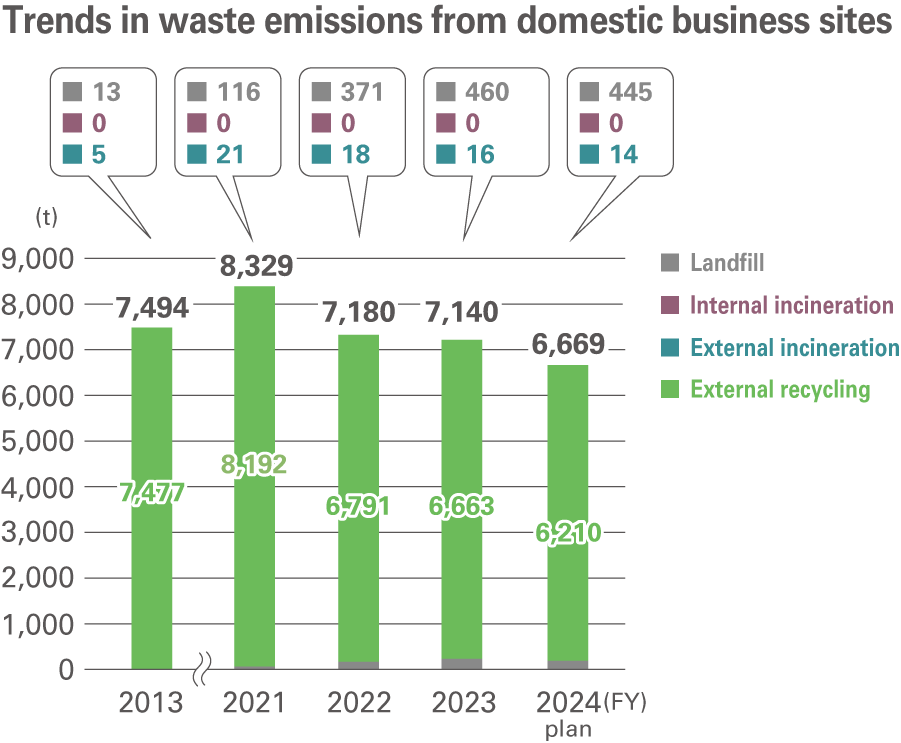
- * Figures include the total of landfill waste, internally incinerated waste, and externally incinerated waste.
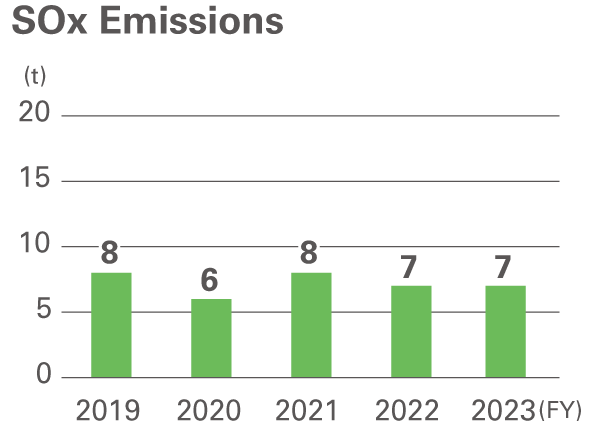
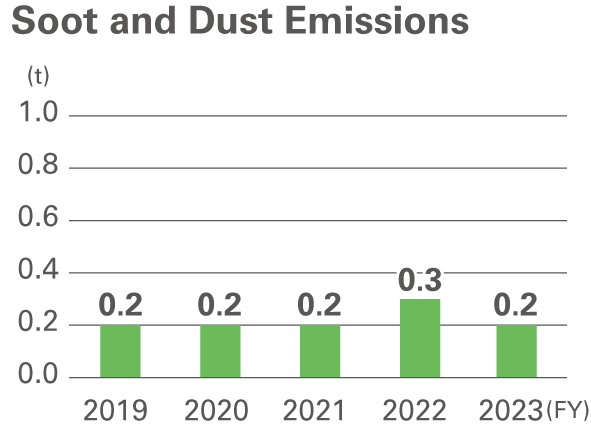
Emissions into the Atmosphere
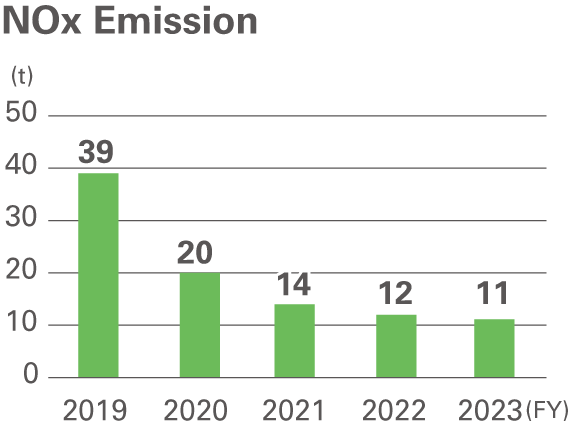
The Group’s business sites in Japan have been promoting a shift of boiler fuel from heavy oil to city gas since fiscal 2004. With the completion of the fuel conversion from heavy oil at the Shizuoka Plant in mid-2019, SOx emissions for the Group as a whole have been further reduced. We were able to greatly decrease emissions of NOx due to a decrease in the nitrogen content of city gas and stabilization of combustion conditions.
Heavy oil is still in use at some business sites in regions where city gas supplies are unavailable, and we are working to optimize the combustion conditions and keep both emissions of SOx and soot and dust down at low levels.
The switch to city gas is also currently being considered to stem the use of heavy oil.
|
|
|
- * NOx emissions are calculated for all domestic business sites covered in the Editorial Policy of the Integrated Report, which are required for measuring NOx emissions by laws and regulations.
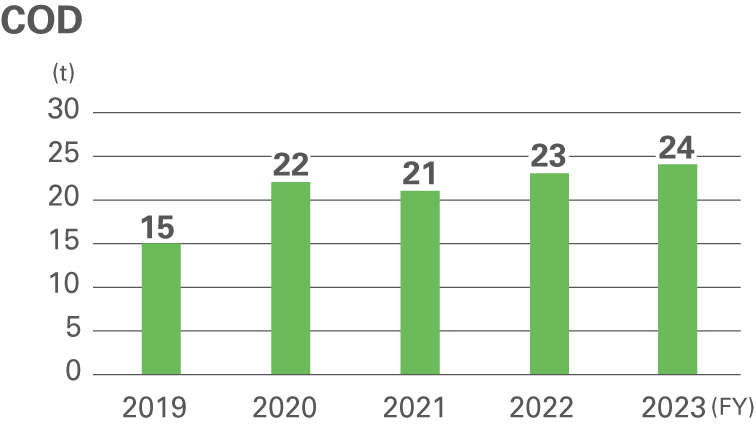
Emissions into the Hydrosphere
Effluent discharged from plants includes pollutants, which are categorized into industrial and household sewage. Treatment facilities, such as high-concentration phenol recovery equipment and activated sludge treatment equipment, and surveillance systems for constant monitoring are in place to ensure compliance with environmental standards and laws and regulations at the national and local government levels. Additionally, risk assessments are conducted on leakages into rainwater that also includes cooling water to prevent sudden and unexpected increases in environmental impacts.
COD load, a typical indicator of water quality, increased only slightly from the previous year in fiscal 2023, and emissions for the whole Company in Japan remain at low levels from a long-term perspective.
- COD load, a typical indicator of water quality, increased only slightly from the previous year in fiscal 2023, and emissions for the whole Company in Japan remain at low levels from a long-term perspective.
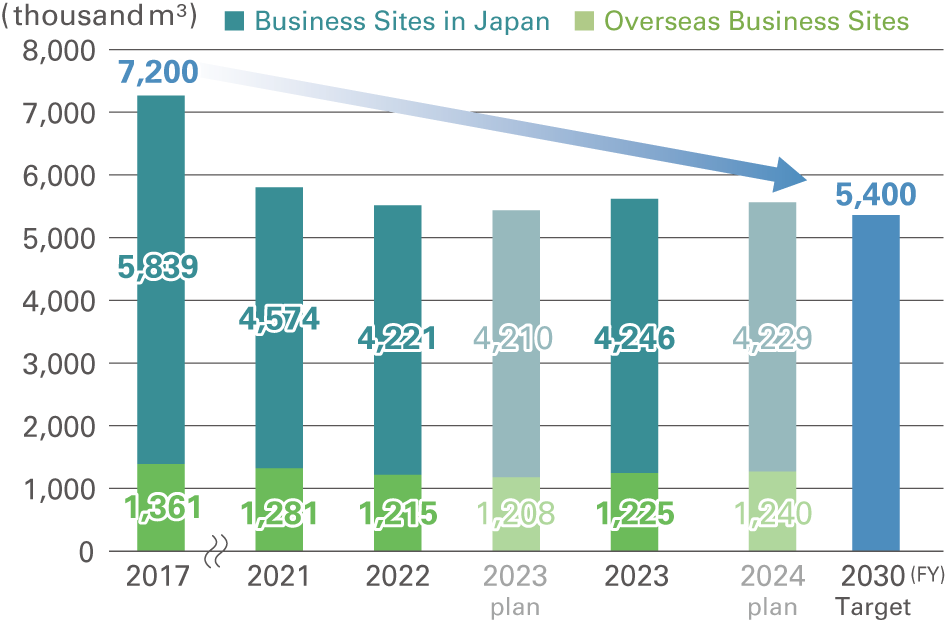
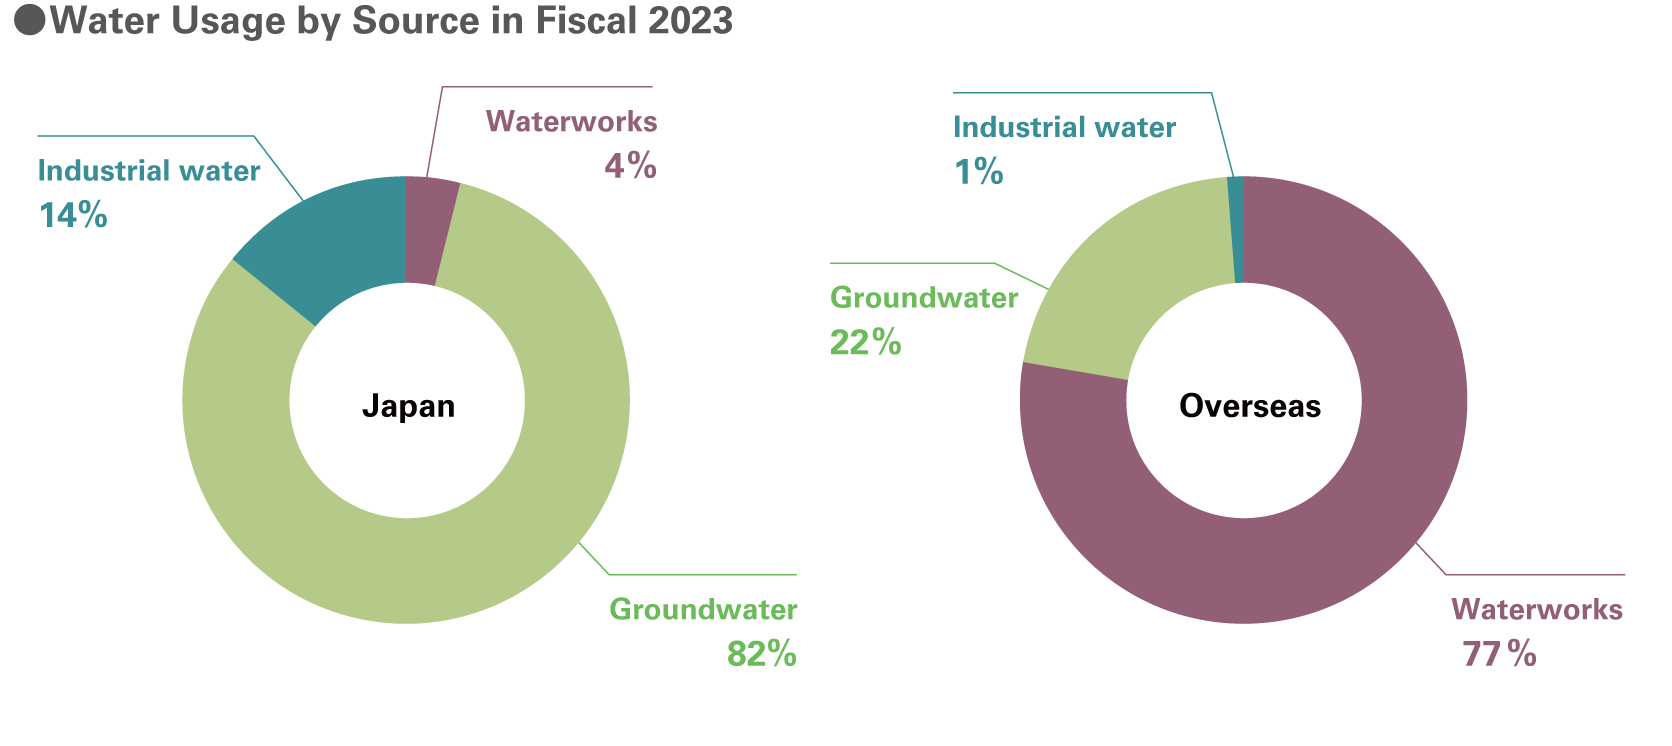
Conservation of Water Resources
When it comes to the water used at our Group’s locations, in Japan a large share of the water used comes from groundwater, while overseas a large share of this comes from waterworks. The water used in our plants in Japan accounts for 78% of the water used by the entire Group.
While we have been continuously striving to reduce our water consumption, we have accelerated our activities by establishing a medium- to long-term target for water use reduction from fiscal 2020, calling for a 25% reduction from the fiscal 2017 level by fiscal 2030.
We are engaging in activities to achieve targets at all business sites. In particular, we are taking a proactive approach to measures at our Shizuoka Plant, which accounts for a large percentage of the Group’s water usage in Japan, and have been achieving gradual reductions. While company-wide water consumption increased slightly in fiscal 2021 and fiscal 2023 due to increased production, reduction efforts at each site resulted in a current reduction rate of 24% from fiscal 2017 for Japan and overseas as a whole over the six years, with progress exceeding original plans.
We will continue to implement steady reductions to achieve our goals.
Water Usage Volume
- * See the organizations listed in Editorial Policy regarding those included in the data.
Assessment of Water-Related Risk in Fiscal 2023
We continuously assess water risks in the regional watersheds where our domestic and overseas group sites are located, and are disclosing information on 17 domestic and 27 overseas sites.
In addition to the results of the WRI* Aqueduct survey, we also conduct our own surveys for water risk assessments that factor in our water consumption. This also adds a water consumption factor based on the scale of each location’s operations, and clarifies the risks by region where our Group operates.
Overseas, there are no sites with high overall water consumption rates, but there is a significant regional increase in water risks in the Southeast Asia and China areas, which will require continued attention. In light of these results, we will undertake more highly effective water resource conservation moving forward.
- * A tool providing information on water risks developed and published by the World Resources Institute (WRI).
Assessment of Water-Related Risk in Fiscal 2023
| Region | Risk level | Total | |||||
|---|---|---|---|---|---|---|---|
| Extremely high | High | Medium to High | Low to Medium | Low | |||
| Japan | Number of bases | 3 | 3 | 11 | 17 | ||
| Water consumption (thousand m3) |
3,752 | 37 | 456 | 4,246 | |||
| China (including Taiwan) | Number of bases | 2 | 3 | 1 | 1 | 7 | |
| Water consumption (thousand m3) |
74 | 124 | 49 | 22 | 269 | ||
| Southeast Asia | Number of bases | 3 | 1 | 1 | 2 | 7 | |
| Water consumption (thousand m3) |
346 | 49 | 48 | 25 | 468 | ||
| North America | Number of bases | 2 | 8 | 10 | |||
| Water consumption (thousand m3) |
298 | 100 | 398 | ||||
| Europe | Number of bases | 1 | 1 | 1 | 3 | ||
| Water consumption (thousand m3) |
53 | 3 | 54 | 110 | |||
Soil/Underground Water Pollution Countermeasures
Response to Soil/Underground Water Pollution
Our Group carries out risk assessments relating to leakage of chemical substances at all of our business sites, and we promote both the development and implementation of preventive frameworks. At the same time, when contamination caused by past leakage accidents is confirmed, we actively undertake voluntary surveys and institute countermeasures in order to prevent the environmental impact and health damage from spreading.
We did not suffer any severe leakage accidents in fiscal 2024.
Results of Soil and Groundwater Studies, Related Actions, and Monitoring
| Site | Results of investigation | Countermeasures and monitoring results |
|---|---|---|
| Amagasaki Plant | Lead was detected by soil content sampling in 2009 and 2010 (max. 500 mg/kg, whereas the standard is 150 mg/kg). No groundwater contamination was detected. | Heavy metals exceeding the standard values of the Soil Contamination Countermeasures Act were detected at the business sites on the left. Monitoring of the groundwater is conducted at these sites every year and their contamination levels have been confirmed to be below standard values. |
| Akita Sumitomo Bakelite Co., Ltd. | Lead was detected by soil elution sampling in 2005 (max. 0.032mg/L, whereas the standard is 0.01 mg/L). No groundwater contamination was detected. | |
| Yamaroku Kasei Industry Co., Ltd. | In January 2016, 1,4-Dioxane in excess of the standard concentrations was detected in the company’s cooling water effluent, with concentrations of a similar amount confirmed in well water drawn from on the premises that had been used. In consultation with the government, the plant stopped drawing water and switched to a closed water cooling system. The company has no history of using the substance in question. | The company cooperates with an ongoing monitoring survey of the groundwater quality that is regularly conducted by Osaka Prefecture, and also continues to perform independent examinations as well. The latest measurement results were 7.3mg/L (standard value of 0.05mg/L). |
Initiatives for Resource Recycling
Marine plastics
When it comes to the problem of marine plastics, we are moving ahead with activities to contribute to reducing plastic marine waste via a number of initiatives based on the Japanese government’s Plastic Resource Recycling Strategy. These initiatives include managing the raw materials used and the plastic products we manufacture, promoting the recycling of said products, and developing new products.
We are currently taking part in the Clean Ocean Material Alliance (CLOMA), which was established by a broad range of business operators related to supply chains for plastic products, including those in the chemical industry and distribution/retail industries, with the goal of forming cross-industry partnerships. Through this, we are working to address a variety of challenges by aiming to curb plastic waste across our supply chain as a whole and promoting recycling via 3R activities for plastic products.
Recycling
Our Group promotes recycling as a means to make efficient use of resources. This recycling includes the recovery and recycling of phenol from waste liquid produced by phenolic resin reactions during the product production process, fine grinding of offcuts from phenolic laminated sheets and decorative melamine resin decorative laminates for use as a filler in phenolic molding compounds reuse of molded parts by-products (sprues and runners) as raw material for molding materials, as well as reuse of excess sludge from activated sludge effluent treatment equipment as compost (organic fertilizer).
Renewable raw materials
Our Group has been using inedible plant-derived raw materials as renewable raw materials, primarily of phenolic resins (cashew nutshell oil, rosin (pine resin), wood flour, etc.) and molding compounds. They account for about 2.7% of all raw materials used.
In fiscal 2022 we added to our lineup packaging films for food and pharmaceutical products made from renewable biomass materials, and in April 2023 we added eco-friendly phenolic molding compounds using plant-derived lignin.
Response to the Fluorocarbon Emissions Control Act
Details of the “Fluorocarbon Emissions Control Act” that was enacted in April 2015 and further enhanced in April 2020 have been provided to each business site to ensure that they conduct regular quick inspections of the commercial air conditioners and freezer systems under their possession, and regular inspections as required by law for equipment with a rated output of 7.5 kW or higher. Given that there are a large number of air conditioners, particularly for office use, we are also working on strengthening management aspects, such as conducting annual inspections through internal audits to prevent omissions and missing inspections during upgrades.
We are also promoting the switch to refrigerants with zero ozone depletion potential and low global warming potential, with a view to preventing depletion of the ozone layer and curbing global warming.
Existing facilities are regularly inspected on a yearly basis for the amount of leakage in accordance with the “Fluorocarbon Emissions Control Act,” to check that there are no leaks in amounts that are required to be reported.
We were also awarded the highest rank of "A" in the “Third JRECO CFC Control Measure Rating” that assesses efforts to comply with the Fluorocarbon Emissions Control Act run by the Japan Refrigerants and Environmental Conservation Organization, which aims to enlighten and promote compliance with the Act, together with the Ministry of Economy, Trade and Industry and the Ministry of the Environment.
Topics More
- 2024/10/01 Sustainability Sumitomo Bakelite Co., Ltd. signed to the UN Global Compact
- 2024/02/01 Sustainability Sumitomo Bakelite Co., Ltd. announces its establishment of “Human Rights Policy for the Group of Sumitomo Bakelite Co., Ltd.”
- 2023/10/31 Sustainability Integrated Report 2023 of Sumitomo Bakelite Co., Ltd. has been issued.
- 2023/06/21 Sustainability Selected as an iSTOXX® MUTB Japan Platinum Carrier 150 Index
Email us about Sustainability
Inquiry