The figure below shows inputs, including raw materials and energy, and outputs that are products and emissions released into the environment.
The Group is working to minimize its impact on the environment by reducing waste disposed to the environment and reducing the use of raw materials, energy, and water from the perspective of resource-saving. We are also promoting CO2 emissions reduction to achieve carbon neutrality.
Through our ongoing activities, we will contribute to measures against global warming and other climate changes by implementing initiatives that reduce outputs that affect the environment, with respect to increases in input.
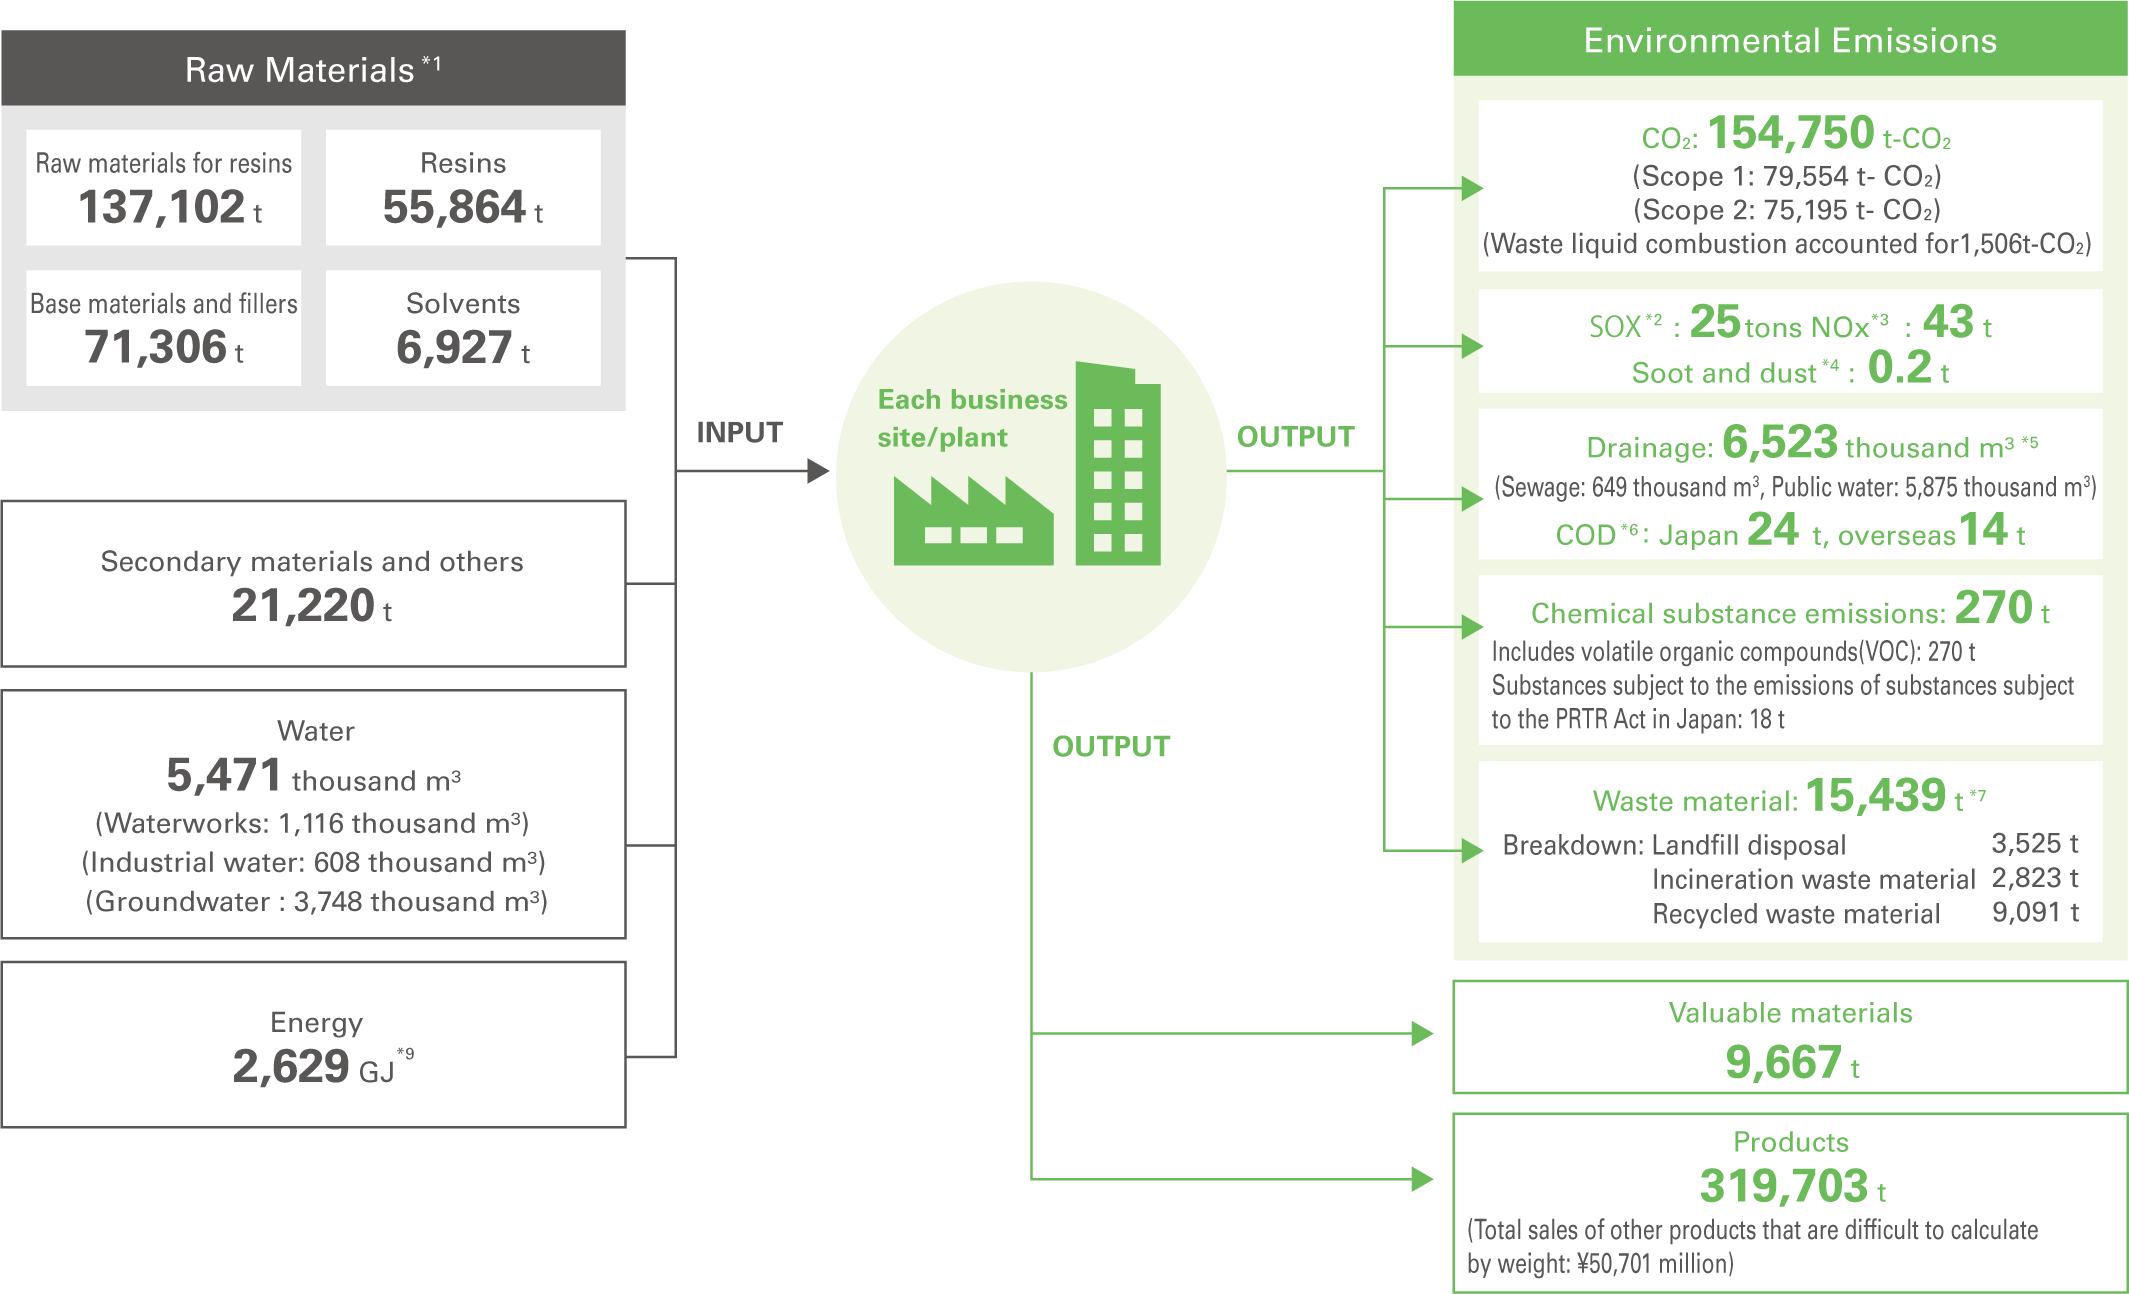
- *1: The ratio of renewable raw materials to total raw materials used is about 2.7% at the current point in time, but we will make efforts from the development stage onward in order to increase the ratio of renewable raw materials use.
- *2, 3, 4, and 6: See the Glossary. SOx, NOx, and soot and dust are calculated using the company's own formula based on exhaust gas readings and fuel usage amount, among other variables. Since methods of calculating emissions of soot and dust differ among countries, this figure is compiled solely for business sites in Japan at present. COD is calculated based on the measured concentration and drainage volume. Data on overseas COD covers sites that measure COD within drainage. Data for overseas sites are stated separately because the types of oxidant (potassium dichromate is mainly used overseas) used for measurement differ from those used in Japan.
- *5: Drainage volume is determined by calculating drainage into sewages based on the breakdown of total usage. Drainage into public water areas is calculated using readings from flow meters installed at business sites; while water usage volume is used for business sites without flow meters.
- *7: The volume of hazardous waste found in our waste came to 5,972 t and non-hazardous waste was 9,467 t. Hazardous waste is based on the categorization of each country and is not subject to assurance.
- *8: VOC (Volatile Organic Compounds)
- *9: Energy consumption has been calculated and disclosed based on the Act on the Rational Use of Energy, but has been changed from the conventional crude oil equivalent (kL) to thermal unit (GJ) from the current period. In addition, thermal conversion coefficient of electric consumption has been revised to 3.6GJ/thousand kWh.
- * The volume of products shipped and value of products sold are not subject to assurance.
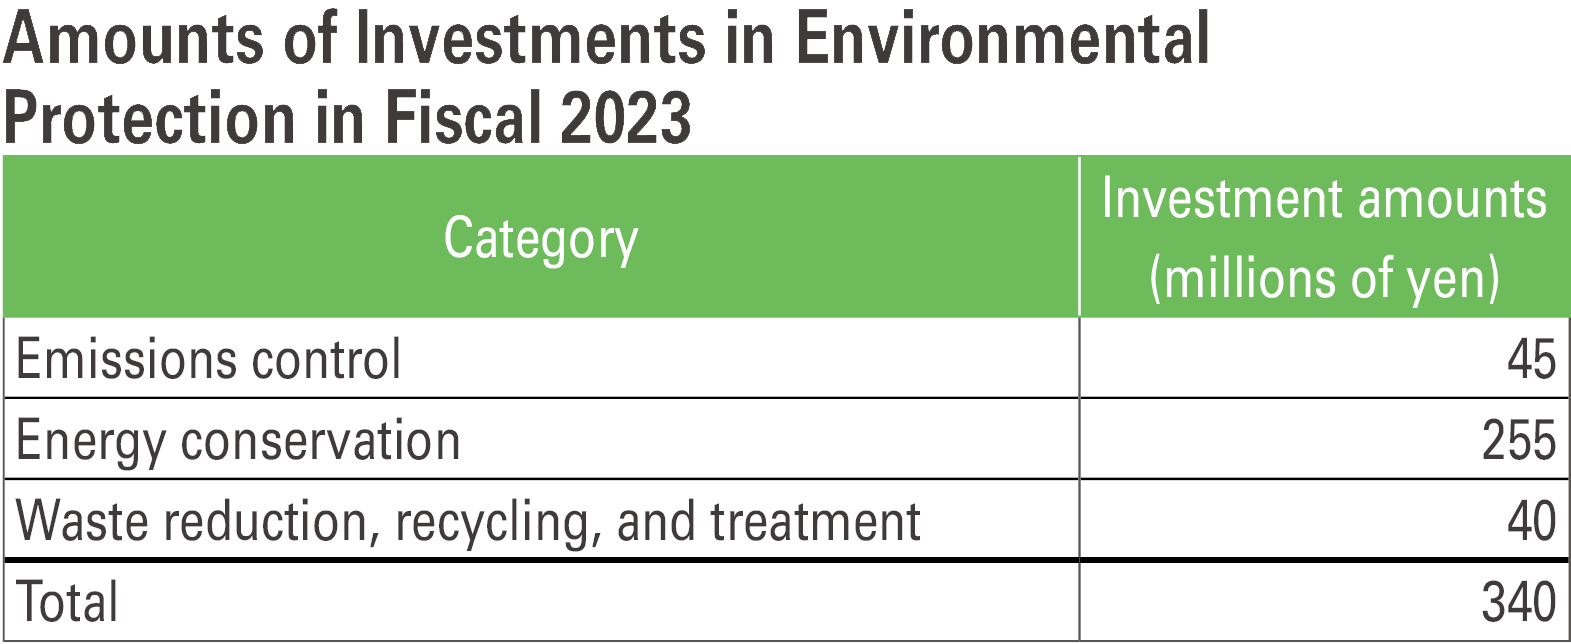
Investments for Environmental Protection
Our Group has compiled data annually on the amounts of investments in environmental protection of all Group companies in Japan since fiscal 2000.
Since fiscal 2020, we have been engaged in a full-fledged effort to adopt solar power generation based on our commitment to carbon neutrality, and we continued to phase it in at each of our business sites in fiscal 2023. Further introduction is planned for fiscal 2024.
We will continue to promote proactive investments in the reduction of CO2 emissions moving forward.
Topics More
- 2024/10/01 Sustainability Sumitomo Bakelite Co., Ltd. signed to the UN Global Compact
- 2024/02/01 Sustainability Sumitomo Bakelite Co., Ltd. announces its establishment of “Human Rights Policy for the Group of Sumitomo Bakelite Co., Ltd.”
- 2023/10/31 Sustainability Integrated Report 2023 of Sumitomo Bakelite Co., Ltd. has been issued.
- 2023/06/21 Sustainability Selected as an iSTOXX® MUTB Japan Platinum Carrier 150 Index
Email us about Sustainability
Inquiry